In the world of algorithmic trading and technical analysis, the Holy Grail is a myth. However, if there is one tool that serves as the bedrock for more institutional systems than any other, it is the Moving Average (MA).
Retail traders often discard the Moving Average as too simple or lagging, yet it remains the most mathematically sound method for extracting signal from noise.
But is it truly the greatest indicator a trader could have? To answer that, we must move past surface-level charts and delve into the quantitative mechanics of price action.
And if you think that sounds nerdy, you’re right. Don’t worry. We’ll sexy it up.
The Quantitative Foundation: Moving Averages as Low-Pass Filters
To understand why the Moving Average is powerful, we must view it through the lens of digital signal processing (DSP).
Which is a nerdy term for how computers (magic maths boxes) interpret information. This will all make sense in a second.
In quantitative terms, price action is a noisy signal consisting of:
-
The Trend (The Signal): The underlying directional bias.
-
The Noise (The Variance): Stochastic price fluctuations caused by high-frequency trading, order flow imbalances, and minor news.
A moving average acts as a low-pass filter.
In physics and engineering, a low-pass filter allows low-frequency signals (the long-term trend) to pass through while “filtering out” the high-frequency oscillations (the noise).
(Extracting the signal, ignoring the noise)
Mathematically, the simple moving average (SMA) looks anything but simple.
It’s defined as:
SMA = (P1 + P2 + … + Pn)/n)
Let’s translate for any non-mathheads:
Where P = the price of a period, starting from the input (i.e. if you have a 20 period moving average, the first price will be from 20 periods ago, then the next period will be added and so on, until you get to the most recent closed price period).
n = the total number of periods.
Most importantly, by averaging price over n periods, you are essentially performing a mean-calculation over a sliding window.
This reduces the standard deviation of the dataset, allowing the trader to see the ‘expected value’ of the asset over a specific look-back period.
This might sound like gibberish, but if you pull up a chart, add a moving average & REMOVE the price you’ll see what I mean.

Autocorrelation (Serial Correlation)
Quantitative traders use the Moving Average because financial markets exhibit autocorrelation – the tendency for price changes today to be correlated with price changes yesterday.
If a market is trending, the price is not a ‘random walk.’
The MA helps quantify the strength of this correlation.
When the price is consistently above a 200-day MA, the probability of a positive return in the next period is statistically higher than in a mean-reverting environment.
The Problem of Non-Ergodicity
Most retail traders treat the market as ‘ergodic’.
They assume that what happened in the past will perfectly repeat.
Which tends to make them overconfident & blind to all the other stuff that could happen instead.
Quantitatively, markets are non-ergodic.
Which is a nerdy way to say that the ‘average’ outcome of a thousand traders is not the same as the outcome of one trader over a thousand days.
The MA provides a dynamic mean.
Unlike a fixed average, it evolves as price changes.
This allows trend followers to adapt to the ‘shifting mean’ of the market, ensuring they are always aligned with the current regime rather than a historical ghost, where news & buying and selling has not influenced current price.
Lag vs. Accuracy: The Quantitative Trade-off
The primary criticism of the Moving Average is lag. However, in quantitative finance, lag is simply a trade-off for reliability.
-
Short-term MAs (e.g., 9-period EMA): low lag, but high noise (high type I error: false positives).
-
Long-term MAs (e.g., 200-period SMA): high lag, but high reliability (low type I error).
The ‘greatness’ of the indicator comes from its ability to be optimized for signal-to-noise ratio (SNR).
By using Exponential Moving Averages (EMA), which apply a multiplier to give more weight to recent data, traders can reduce the weight of ‘stale’ information…
This weighting allows a trader to stay closer to the current price reality while still benefiting from the filtering properties of the moving average.
Fat Tails and Kurtosis: Why Trend Following Works
In a Gaussian normal distribution (bell curve) extreme price moves shouldn’t happen often.
But, markets don’t follow a normal distribution.
They have fat tails (high kurtosis) – meaning Black Swan events and massive trends happen more often than standard statistics predict.
The moving average is the premier tool for capturing these fat tails.
While a mean-reversion trader gets blown up and battered during a massive trend, the moving average keeps the trend follower on the right side of the distribution (as long as its used with logic and systematic risk management).
It doesn’t predict where the peak is…
But it certainly ensures you are present for the meat of the move – again, if used with logic and understanding of what you are actually doing.
Beyond the Maths: The Role of Discretionary Catalysts
While the MA provides the rules of engagement it does not provide the context.
Success lies between the fundamental narrative of a stock and the quantitative context.
We at Fink view the market as a storytelling machine.
When Tesla showed net income at $299mm for Q1 of 2025, we put a little drawing on our chart to note this key area.
It couldn’t go lower than this.
Look at its share price since…
Quantitative indicators tell you what is happening, but discretionary catalysts tell you why it is happening and, more importantly, when the probability of a shift is highest.
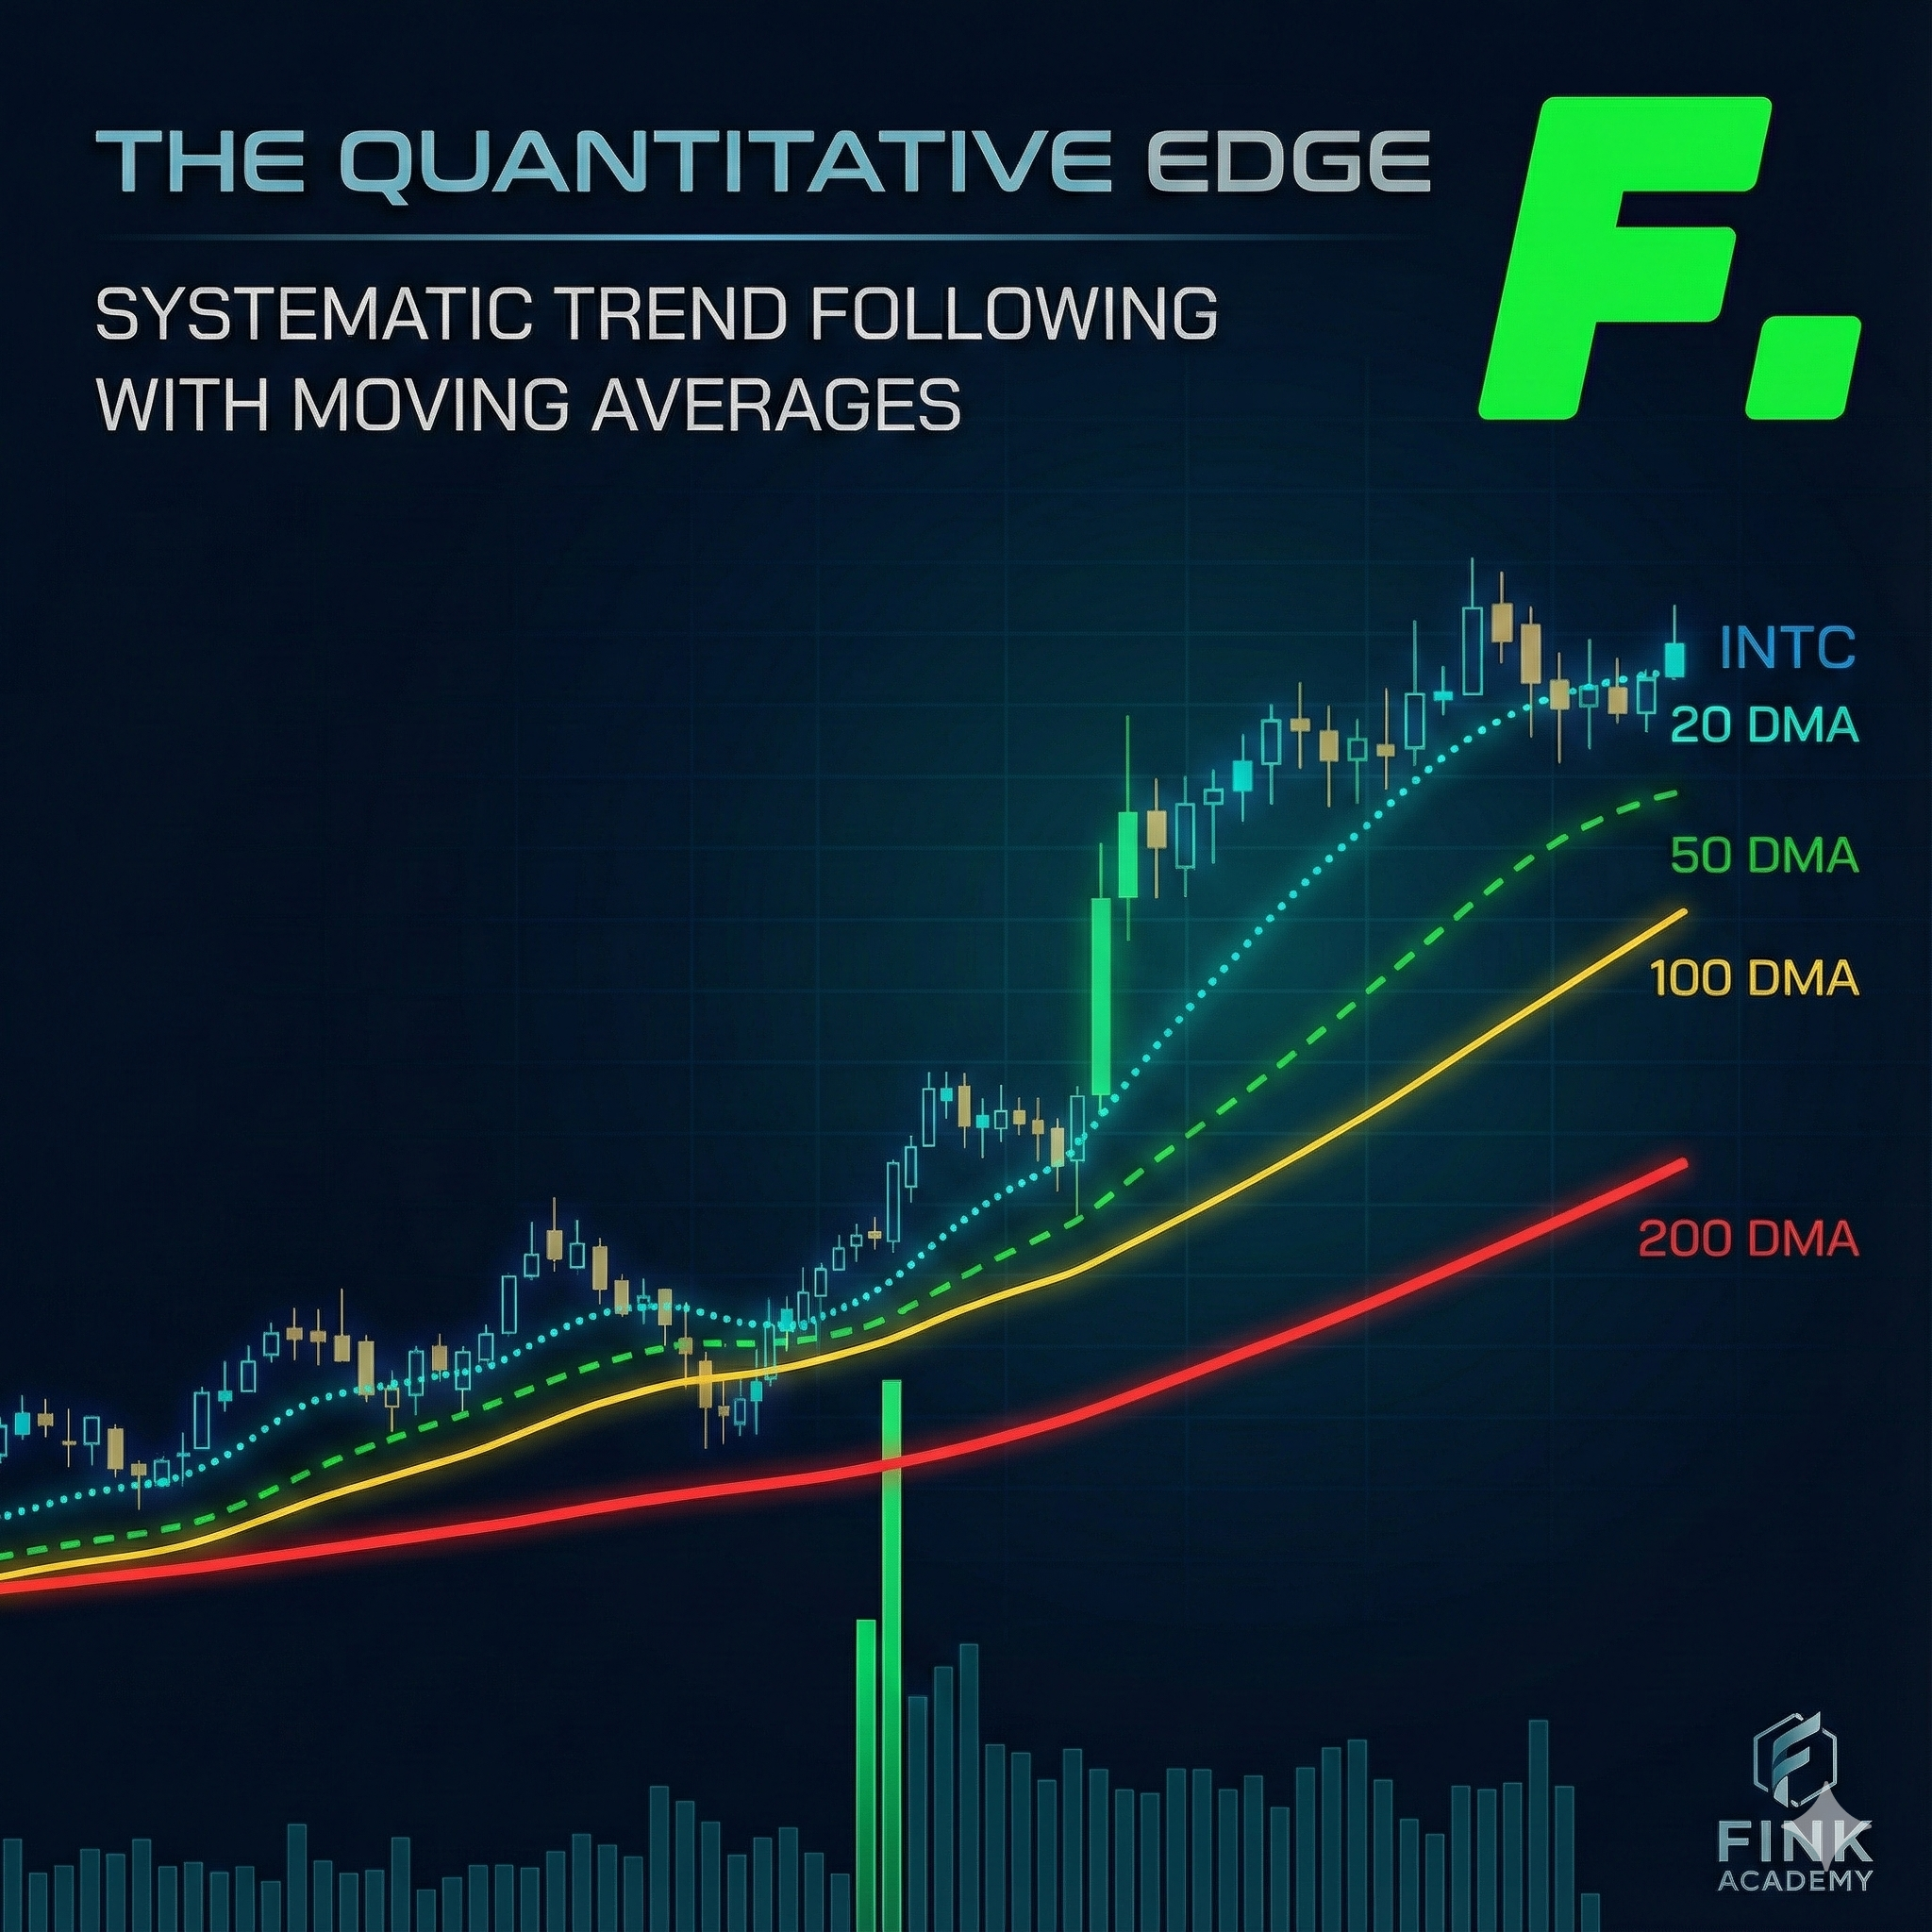
The America First Case Study: Intel (INTC)
Consider the resurgence of Intel.
From a purely technical perspective, Intel had lagged behind its peers in the semiconductor space for years.
However, we looked at the discretionary, macro environment.
Trump wanted manufacturing back on shore, US firms to be even stronger on the world stage and this is evident in his America First stance.
This creates a sentiment divergence.
The story says ‘potential’, but the price action must confirm the reality.
We don’t buy simply because of the news…
Instead, we waited for the breakout cluster.
When Intel showed the alignment with our momentum factor strategy and the discretionary elements, that was the tell to pull the trigger.
You can watch me explain it in this video.
After this, Intel traded right up to $44… that’s 100% in a very short space of time, all spelled out beforehand.

The Systematic Risk Framework: ATR and Multi-Tiered Exits
If the moving average is the greatest indicator for entry, volatility adjusted risk management is the greatest tool for survival.
Most traders fail because their stops are arbitrary.
At the Fink Academy, we use the average true range and moving averages to create a non-discretionary exit strategy – you MUST make your risk management objective to counteract the dumb shit you might do from the discretionary side.
The Hard Stop: 50-Day ATR
The ATR measures market movement over a period of time.
By using a 50-day ATR, you are calculating the asset’s natural volatility.
We place a hard stop at a multiple of the ATR to ensure that we are only taken out of a trade if the character of the market changes, rather than getting pipped out by a minor intraday/week fluctuation.
The Trailing Exit: Systematic Profit Harvesting
As the trend matures, the goal shifts from protection to preservation. We utilise a systematic trailing exit based on the Moving Average hierarchy:
-
The 20-DMA: The first sign of momentum exhaustion.
-
The 50 and 100-DMA: The core of the trend.
If the market closes below these levels, the system dictates a reduction in exposure.
This removes the emotional hope that a failing trade will recover.
However, the system is symmetrical.
If the price regains its footing and closes back above these MAs, the strategy allows for re-loading the position (as long as some other factors are taken into account).
The ability to admit the trend has paused and the humility to get back in when the signal returns is vitally important.
There is more to it due to the requirement to fundamentally understand the task at hand, but if you were to try and incorporate this after reading, you will likely see some improvement.
Moving Beyond the Day-Trading Trap
The frustration of day trading often stems from over optimisation.
By looking at 1-minute or 5-minute charts, you are trading in a zone where the signal-to-noise ratio is near zero.
You are competing with HFT (High-Frequency Trading) algorithms that can execute in microseconds – you’re fucked, in essence.
As Robot James eloquently put it, ‘it’s like turning up to play prime Federer but you have a dildo for a tennis racket… and you’re retarded.’
By shifting to a trend following approach on higher time frames (daily/weekly) using moving averages, you are moving the battlefield to a domain where human intellect and institutional capital flows matter.
You are no longer trying to predict the next tick like the HFTs…
You are riding the massive waves of capital reallocation that take weeks or months to resolve.
Statistical Expectancy: Why You Only Need to be Right 40% of the Time
In quantitative terms, the success of this strategy is based on positive expectancy…
-
W: average win (large, because we trail MAs)
-
L: average loss (small, capped by ATR)
-
Pw/Pl: probability of win/loss
Trend following using moving averages naturally creates a right-skewed distribution of returns.
You will have many small losses (where the MA exit triggers quickly) and a few massive, fat tail wins.
This is how portfolio growth is actually built – not through a 90% win rate, but through systematic risk management and the patience to let a trend reach its mathematical conclusion.
You want home runs over the long run – you don’t want stupid ‘let me risk 1% of my account balance 10x per day and stress myself out’).
Transform Your Trading: Join Fink Academy
You have spent years watching candles flicker and feeling the burnout of the intraday grind. It is time to graduate to a systematic method that respects the math of the market and the reality of macro and micro catalysts.
At the Academy, we don’t just give you a ‘strategy’…
We provide a comprehensive framework for ideation, execution, and systematic risk management.
We teach you how the market actually moves, how to spot the next Intel before the crowd, and how to use trend following to build the portfolio you need.
Once you’re done, you join our community for life.
It’s perfect for busy professionals and business owners who feel stuck with no systems.
We aren’t promising the Holy Grail, but we’re promising structure and consistency.
Stop guessing. Start calculating.