When when you hear people say “what is the bond market telling us?” isn’t there some part of you that wants to know what they’re on about?
Guess what? You’re in luck!
We promise to keep it as light as possible AND there’s a fantastic TradingView indicator at the bottom of this post to help you monitor these regimes.
PLUS a video explaining how to apply these regimes way beyond bond markets (bonds are only traded by people you’d never want to meet in dark alleys or at parties)
First up, we need the definitions.
What’s a yield curve?
A yield curve is a graphical representation of the relationship between bond yields and their maturities, typically for government bonds.
Why does it matter?
It provides insights into market expectations for economic growth, inflation, and central bank policy. The shape of the yield curve: upward-sloping, flat, or inverted offers critical signals about the state of the economy.
When does it matter most?
When regimes change!
Changes in the curve’s slope are classified into four main regimes: bull steepening, bear steepening, bull flattening, and bear flattening.
Each regime reflects different economic conditions and central bank actions.
They offer clues to the outlook that can help us decide when to press the accelerator to the floor, when to hit the brakes and everything in between.
Yield Curve Regimes
1. Bull Steepening
- What it is: Short-term interest rates fall faster than long-term rates, causing the yield curve to steepen.
- Economic context: Bull steepening often occurs when markets anticipate rate cuts due to economic weakness or a potential recession. This reflects optimism about future monetary easing but concern about current economic conditions.
- Central bank actions: Central banks are likely to lower policy rates to stimulate growth and counteract deflationary pressures.
- Example: During late 2020 and early 2021, the Federal Reserve kept rates near zero while fiscal stimulus boosted long-term growth expectations
2. Bear Steepening
- What it is: Long-term interest rates rise faster than short-term rates, steepening the curve.
- Economic context: This regime typically signals rising inflation expectations and/or stronger economic growth. It can occur when central banks maintain short-term rates while long-term yields increase due to higher term premiums or fiscal stimulus.
- Central bank actions: Central banks may remain cautious initially but could tighten policy if inflation becomes persistent.
- Example: In 2023, bear steepening occurred as long-term yields rose sharply due to strong economic activity despite elevated short-term rates

3. Bull Flattening
- What it is: Both short- and long-term yields decline, but long-term yields fall more sharply, flattening the curve.
- Economic context: This regime often arises when inflation expectations drop significantly, and markets expect central banks to ease monetary policy further.
It can also occur when short-term rates are near zero, limiting their downward movement. - Central bank actions: Central banks may adopt a dovish stance but have limited room for further rate cuts if short-term rates are already low.
- Example: The 2016 period saw bull flattening as weak global growth kept front-end yields anchored while long-end yields declined further
4. Bear Flattening
- What it is: Short-term yields rise faster than long-term yields, flattening the curve.
- Economic context: This regime often reflects central bank tightening in response to high inflation or an overheating economy. It suggests that monetary policy is restrictive and could slow future growth.
- Central bank actions: Central banks aggressively raise interest rates to combat inflation, even at the risk of slowing economic activity.
- Example: In 2022, the Federal Reserve raised rates rapidly to fight inflation, causing short-term yields to rise while long-term yields reflected lower growth expectations

Typical Yield Curve Relationships With Economic Regimes
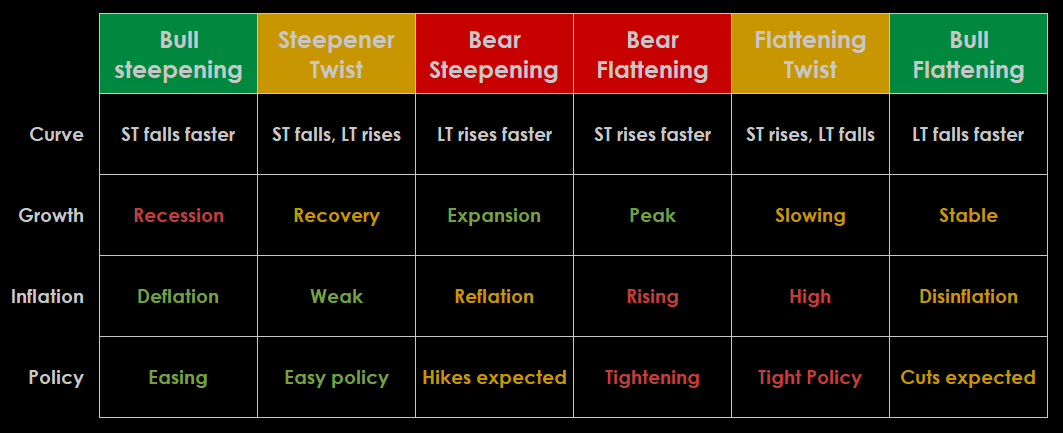
Obviously, this isn’t an exact science. Markets will shift between regimes throughout the economic cycle as changes in data and policy affect expectations.
Understanding these regimes can provide crucial context for your trades.
Here’s just one example: ‘falsifying’ the yield curve un-inversion as a recession indicator…

So here’s the link to Doejistar’s Yield Curve Indicator which is fully explained in the video below, along with actionable insights & a more in depth explanation of the yield curve & economic regimes.