Most investors are creatures of habit.
They check the P/E ratio, maybe glance at the Price-to-Book (P/B), and find the one that best supports their existing bias.
But a single metric never tells the whole story.
Uncovering that story through fundamental analysis is the entire point of researching a stock.
One combination I find particularly powerful in the current market is: a low Price-to-Sales ratio, high debt-to-equity, and falling interest rates.
Using the Price-to-Sales ratio (P/S) allows you to see how much the market is paying for every dollar of a company’s revenue, which is often more stable than earnings.
Why High Debt Isn’t Always a Red Flag
At first glance, high debt looks like a dealbreaker.
However, when interest rates are falling, high debt can become a strategic advantage.
Companies can refinance at lower rates, instantly improving cash flow and strengthening the balance sheet.
When you pair this with a low Price-to-Sales ratio (meaning you’re paying less for every dollar of revenue), you often find an undervalued gem.
This setup works exceptionally well in “unsexy” sectors often covered in our market analysis reports.
- Utilities & REIT’s: Steady cash flows service debt easily while lower rates boost valuations.
- Industrials: Lower borrowing costs allow for aggressive reinvestment in growth.
- “Unloved” Tech: Growth companies that were sidelined during high-rate cycles.
Analysing the Apple Price-to-Sales Ratio
The Price-to-Sales ratio is simple but massively underappreciated. It measures the current share price against the sales generated by the business.
P/S Ratio = Market Capitalization / Total Sales (Revenue)
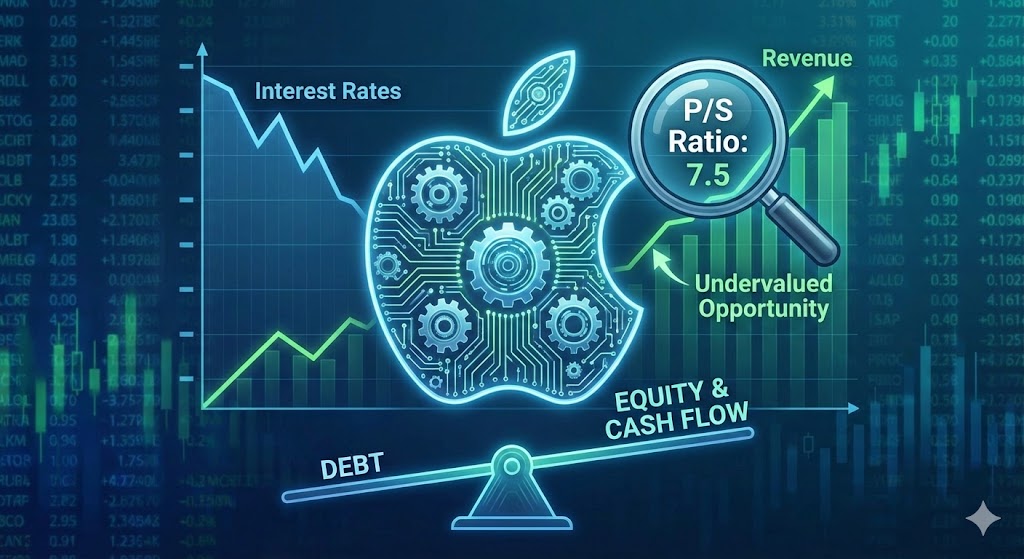
Let’s look at Apple (AAPL).
Currently, Apple’s Price-to-Sales ratio sits at approximately 7.5.

A spreadsheet-driven investor might see this and claim Apple is overvalued.
Over the last 13 years, Apple’s P/S has ranged from a low of 2.24 to a high of 10.08, with a median of 5.57.
While 7.5 is above the long-term median, it is approaching the lower end of the range where investors typically ‘pull the trigger.’
The “Sales” Story: Beyond the iPhone
The “P” (Price) in Apple’s ratio is down roughly 19% year-to-date. But the “S” (Sales) side of the ratio is where the real story lives.
While media headlines obsess over slowing iPhone sales, Apple’s Services revenue just hit a record $26.6 billion, smashing expectations.
Over the past 12 months, Apple has raked in more than $400 billion in annual sales.
Potential Catalysts for Apple Growth:
- Manufacturing Shifts: Moving production to India to mitigate China-related tariffs.
- Service Integration: A potential acquisition or partnership (like Perplexity AI) could supercharge the Apple One bundle.
- AI Integration: Cracking the AI code could drive a massive upgrade cycle.
- Aggressive Buybacks: Apple continues to reduce its share count via buybacks.

Since the Price-to-Sales ratio is calculated per share, a shrinking share count combined with growing revenue makes the “S” side look incredibly attractive.

How to Apply This Price-to-Sales Ratio Strategy
Don’t just take my word for it. Try filtering for companies using these parameters:
- Price-to-Sales ratio below 2.0: Suggests the market might be overlooking revenue power.
- Debt-to-Equity between 0.5 and 1.5: Sufficient leverage to benefit from falling rates.
The Price-to-Sales ratio tells you what the market thinks of a company’s top line.
In Apple’s case, the revenue engine is shifting gears, not slowing down.
The question isn’t if the sales are there, it’s when the price will finally respond.
Next: We’ll dive into the Price-to-Earnings (P/E) ratio and combine these metrics to build a bulletproof investment thesis.